User Tools

Site Tools


processing:workflow_dac_data

Processing actual multigrain diffraction data from a diamond anvil cell experiment

That's it, you have been trained in multigrain XRD data processing. You feel that you are ready for real data from a diamond anvil cell experiments!

Tough parts with diamond anvil cell data include

  • shadows from the DAC itself,
  • Compton background from the diamond anvils,
  • single-crystal diffraction from the diamond anvils,
  • typically, unknown phases and cell parameters,
  • poor diffraction quality.

Obviously, unlike data from simulations, you do not know the answer! You do not know the grains you will be looking!

Workflow outline

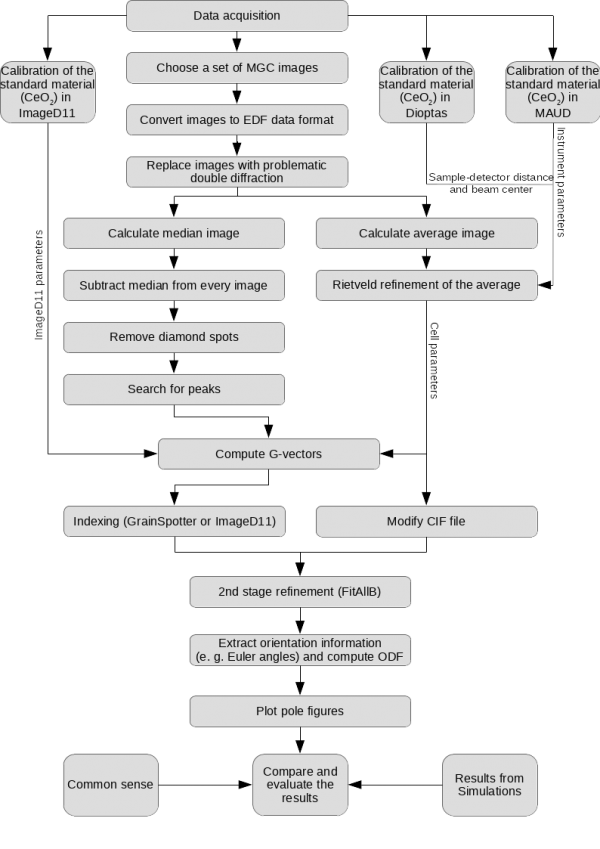
Here is a simple outline of what you should do:

  1. Calibrate your experiment. This should be done with either Dioptas or Fit2D. Beam centers and detector distances you find in Dioptas or Fit2D will be used at a later stage of the processing.
  2. Understand the concept of an O-Matrix and figure out your own.
  3. We often also calibrate Maud as this point. We will use it later to figure out the cell parameters of our sample. As you start using MAUD keep a note of the parameters you use to convert your tiff images into ESG. You will need to use exactly the same ones on your sample images later.
  4. Later, for each P/T point you wish to study

Data processing flow chart

processing/workflow_dac_data.txt · Last modified: 2020/03/25 09:36 by matthias