User Tools

Site Tools


processing:phase_identification

Identify sample phases

Before you move on to multigrain indexing, you will need to know:

  • what phases you are looking for,
  • their crystal structures and cell parameters.

If you have a decent powder diffraction pattern to work with, you can try to do so with typical software people use in DAC experiments: dioptas, maud, etc.

There is a second option:

  • collect diffraction peaks using peak-search,
  • generate a 2-theta histogram of peaks.

This will be discussed below.

2-theta histograms

Generating a 2-theta histogram of peaks identified with a peak search has several advantages:

  • most of the background signal (diamonds, shadows, etc) has been removed,
  • a strong powder signal from the pressure medium will be partly removed,
  • the signal from the sample you are trying to index is stronger,
  • the histogram is based on the peak center of mass only, and hence removes the broadening due to grain size or internal strains.

Some drawbacks

  • this is not a true powder diffraction pattern, peak broadening, in particular, is different,
  • pay attention to peak intensities
    • older versions of ImageD11 created histograms of number of measured peaks → intensity in the histogram should be proportional to the peak multiplicity
    • new version have an option weight_hist_intensities. If this option is set to True or 1, histograms are weighted by the peak intensities. These should be closer to a true powder diffraction intensity, but also affected by very large grains in the sample.

Creating and exporting a 2theta histogram

This can be done in ImageD11. Once calibrated for tilts, beam center, detector distance, etc, you can select

  • Transformation → Load Filtered Peaks
  • Transformation → Plot tth histogram

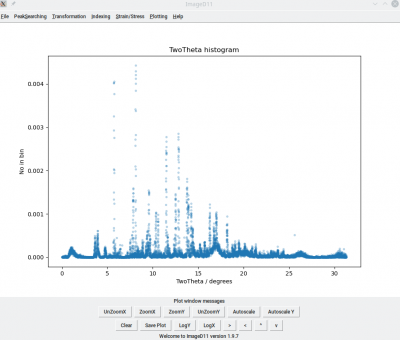
ImageD11 will ask for a number of bins (10000 is good) and you will get something like the screenshot below. New versions of ImageD11 (as of Feb 2021) have an option weight_hist_intensities. If this option is set to True or 1, histograms are weighted by the peak intensities. If this option is set to False or 0, histograms are based on the number of measured peaks.

Newer versions of ImageD11 (update February 2021) can then export this histogram using Transformation → Export tth histogram

Phase identification and peak fitting

You can use PDIndexer to identify your phases and fit their unit cell parameters.

To do so

  • Remove the first line in the file (the header),
  • Add a constant background to all intensity values. PDIndexer does not work if your diffraction intensities go to zero. This can be done in excel, for instance,
  • Save the histogram with the new intensity values with an '.xy' extension,
  • Open the XY file in PDIndexer.

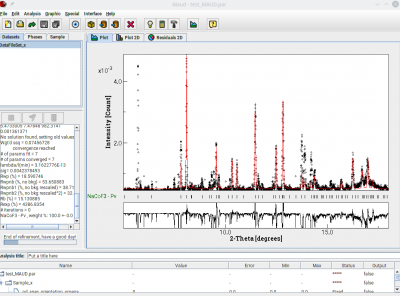
Loading the 2theta histogram in MAUD

It can be useful to load the histogram in MAUD. Remember, however, that this is not a true powder diffraction pattern,

  • peak broadening, in particular, is different,
  • pay attention to peak intensities
    • older versions of ImageD11 created histograms of number of measured peaks → intensity in the histogram should be proportional to the peak multiplicity
    • new version have an option weight_hist_intensities. If this option is set to True or 1, histograms are weighted by the peak intensities. These should be closer to a true powder diffraction intensity, but also affected by very large grains in the sample.

To convert the histogram, use timelessTthHistogram2Maud from the TIMEleSS tools (see details below). Simply provide the detector distance (in mm), the name of the histogram file, and the name of the new ESG file, and you are good to go.

To load the data in MAUD

  • Create a dataset with a simple diffraction instrument,
    • no intensity calibration,
    • flat image transmission, with the proper detector distance, no tilt, no beam center correction, nothing,
    • Synchrotron source with the proper wavelength,
    • Caglioti broadening, with asymmetry parameters set to 0,
  • Load the ESG file

It should work…

Remember, intensities are messed up, but you will get your phases and cell parameters…

timelessTthHistogram2Maud

timelessTthHistogram2Maud  -h
usage: timelessTthHistogram2Maud -d distance histogram.dat data.esg

Creates a MAUD ESG file from a text file with intensity vs. 2theta (in
degrees). This is part of the TIMEleSS project http://timeless.texture.rocks

positional arguments:
  txtdata               Name of file with intensity vs. 2theta
  output                Name of esg file

optional arguments:
  -h, --help            show this help message and exit
  -d DISTANCE, --distance DISTANCE
                        Detector distance (in mm, required)
processing/phase_identification.txt · Last modified: 2023/03/16 14:04 by smerkel