User Tools

Site Tools


evaluation:plotting-grain-orientations

This is an old revision of the document!


Plotting grain orientations

Typically, grain orientations are plotted with MTeX based on the Euler angles of each grain.

Extracting Euler angles

Extracting a list of Euler angles for the indexed grains can be done using timelessExtractEulerAngles, which is part of the TIMEleSS tools.

You will have a list of Bunge Euler angles (using a Bunge convention) as below. You can simply save it in a text file.

-31.88 273.49 206.05
-55.09 133.91 157.65
83.39 235.30 204.46
-47.58 78.99 149.71
-60.87 17.28 33.07

Loading and plotting grain orientations in MTeX

Here is an example of a script that will load these orientations and plot them in a pole figures. The example is for olivine and can be adjusted to your needs.

%%
% Define crystal and sample symmetry
cs_ol = crystalSymmetry('Pnma',[9.915267 5.886196 4.713400])
ss = specimenSymmetry()
% Plotting convention
plotx2east
% File with Euler angles
fname = fullfile('/path/to/folder/',...
    '','euler.txt');

%%
% Load file and create the corresponding list of orientations
ori = load(fname)
n = size(ori);
n = n(1);

for i = 1:n
    phi1 = ori(i,1)*degree;
    Phi = ori(i,2)*degree;
    phi2 = ori(i,3)*degree;
    ori0(i) = orientation('Euler',phi1,Phi,phi2,cs_ol,ss);
end

%%
% Plot grain orientations
h = Miller({1,0,0},{0,1,0},{0,0,1},cs_ol)
plotPDF(ori0,h,'antipodal','MarkerSize',10, 'MarkerFaceColor', 'b', 'MarkerEdgeColor', 'b')

Comparing grain orientations in MTeX

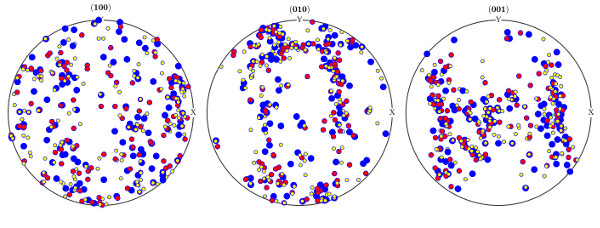
The following script will load results from 3 different indexings a plot the results so they can be compared as on the image below

%%
% Define crystal and sample symmetry
cs_ol = crystalSymmetry('Pnma',[9.915267 5.886196 4.713400])
ss = specimenSymmetry()
% Plotting convention
plotx2east
% Files with Euler angles
fname1 = fullfile('/path/to/folder/',...
    '','euler-1.txt');
fname0 = fullfile('/path/to/folder/',...
    '','euler-2.txt');
fname2 = fullfile('/path/to/folder/',...
    '','euler-3.txt');

%%
% Load file and create the corresponding 3 lists of orientations
ori = load(fname0)
n = size(ori);
n = n(1);

for i = 1:n
    phi1 = ori(i,1)*degree;
    Phi = ori(i,2)*degree;
    phi2 = ori(i,3)*degree;
    ori0(i) = orientation('Euler',phi1,Phi,phi2,cs_ol,ss);
end

ori = load(fname1)
n = size(ori);
n = n(1);

for i = 1:n
    phi1 = ori(i,1)*degree;
    Phi = ori(i,2)*degree;
    phi2 = ori(i,3)*degree;
    ori1(i) = orientation('Euler',phi1,Phi,phi2,cs_ol,ss);
end

ori = load(fname2)
n = size(ori);
n = n(1);

for i = 1:n
    phi1 = ori(i,1)*degree;
    Phi = ori(i,2)*degree;
    phi2 = ori(i,3)*degree;
    ori2(i) = orientation('Euler',phi1,Phi,phi2,cs_ol,ss);
end

%%
% Plot grain orientations from the 3 files in a way they can be compared
h = Miller({1,0,0},{0,1,0},{0,0,1},cs_ol)
plotPDF(ori0,h,'antipodal','MarkerSize',10, 'MarkerFaceColor', 'b', 'MarkerEdgeColor', 'b')
hold on
plotPDF(ori1,h,'antipodal','MarkerSize',8, 'MarkerFaceColor', 'r', 'MarkerEdgeColor', 'b')
hold on
plotPDF(ori2,h,'antipodal','MarkerSize',6, 'MarkerFaceColor', 'y', 'MarkerEdgeColor', 'b')
evaluation/plotting-grain-orientations.1575384651.txt.gz · Last modified: 2019/12/03 14:50 by smerkel