User Tools

Site Tools


evaluation:evaluategrainindexing

This is an old revision of the document!


graphically evaluate the indexing quality for a given grain

timelessPlotIndexedGrain

timelessPlotIndexedGrain -h

usage: timelessPlotIndexedGrain [options] parfile.prm GSFile.log FLT.flt

Compares predicted and measured peak positions for a grain after indexing. Can
plot as an image, in pixels, or with eta or omega vs. 2theta This is part of
the TIMEleSS project http://timeless.texture.rocks

positional arguments:
  par                   ImageD11 parameter file (required)
  gsfile                Name of GrainSpotter output file (required)
  FLT                   FLT file used to generate g-vectors for indexing
                        (required)

optional arguments:
  -h, --help            show this help message and exit
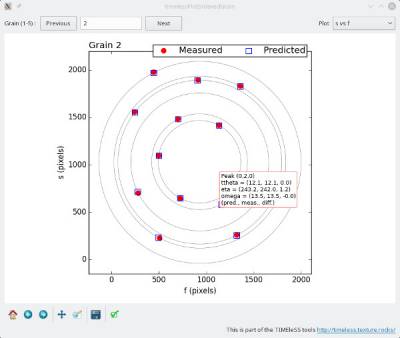
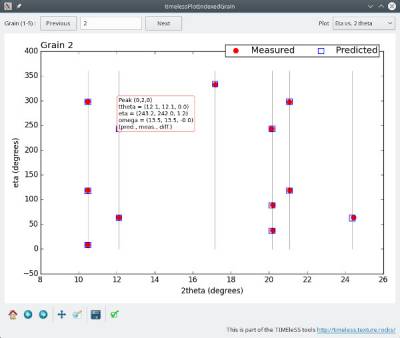
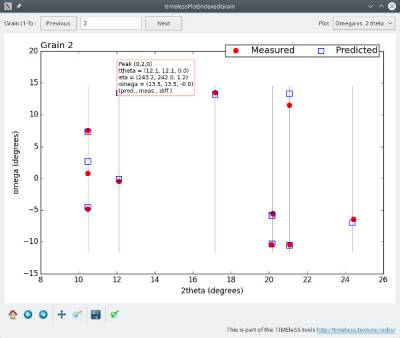
  -p PLOT, --plot PLOT  What do you want to plot ? "svsf" for s vs f in pixels
                        (i.e. diffraction image), etavs2theta for eta vs. 2
                        theta, omegavsttheta for omega vs. 2 theta. Default is
                        svsf.
  -g GRAIN, --grain GRAIN
                        Grain number. Default is 1.

Sample screen shots

 Predicted and measured peak positions for a given grain, plotted with all values of omega stacked into a single frame

evaluation/evaluategrainindexing.1558626610.txt.gz · Last modified: 2019/05/23 15:50 by smerkel