
This is an old revision of the document!
Table of Contents
Grain indexing with GrainSpotter
At this point, you should have a computed all experimental G-vectors. You are now ready for indexing grains with GrainSpotter.
GrainSpotter first generates a number of random grain orientations and, for each, calculates the corresponding theoretical G-vectors. For each grain orientation, GrainSpotter looks for a possible match between the theoretical G-vectors and those found in the experiment. If the convergence criteria are met (see details below), the grain is assigned.
Estimation of the uncertainties
For the indexation, uncertainties in 2θ, η and ω will be critical for assigning the experimental G-vctors to a grain.
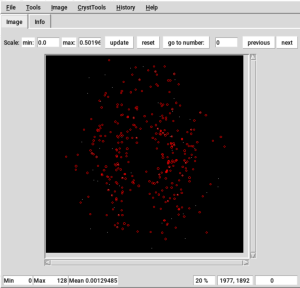
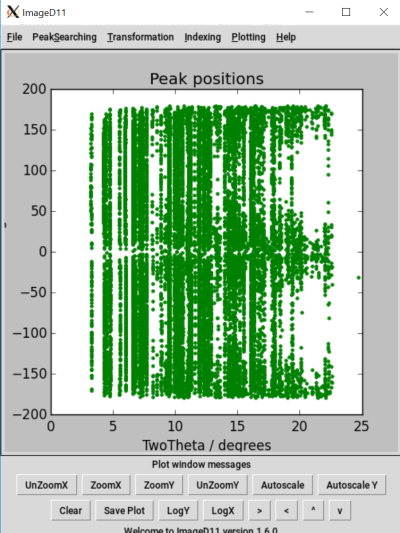
You can use Fabian to estimate uncertainties on ω and η and ImageD11 to estimate uncertainties in 2θ.
To overlap the peaks kept by peaksearch on the diffraction shots, use 'CrystTools' > 'Peaks' > 'read' and choose the filtered peaks file.


From diffraction peaks to G_vectors
ImageD11 will allow you to obtain a .gve file with the G-vectors of the peaks you find with peaksearch.
- open the software with the command :
ImageD11_gui.py
- in the menu 'transformation' click on 'load filtered peaks' and choose the file you obtained with peacksearch;
- in the menu 'transformation' use 'plot y/z';
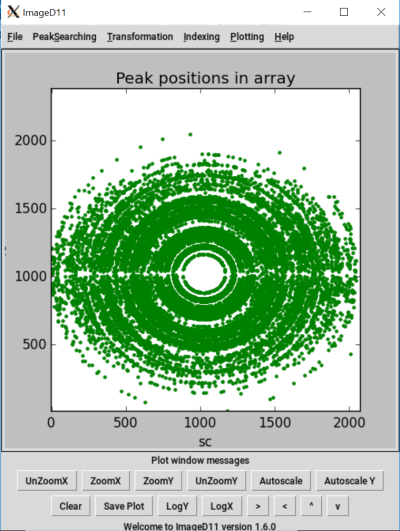
Plot x/y in ImageD11 for 500 simulated fosterite grains with a peaksearch treshold of 2. Tip : if you obtain ellipses instead of circles, try to resize the ImageD11 window.
- enter the parameters of the experiment ('transformation' > 'edit parameters')
- you can save the parameters : 'transformation' > 'save parameters' (end the name of the file by .prm);
- clear the plot and use 'transformation' > 'plot tth/eta';
tth/eta plot for the same set of grains.
- in 'transformation' click on 'add unit cell peaks'
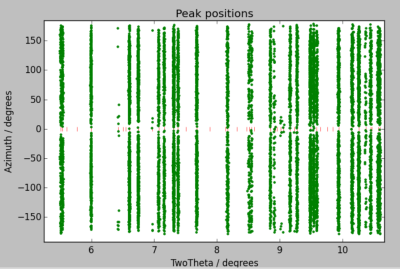
Zoom on peaks positions between 2θ=5 and 2θ=11(again, same set of data). Unit cell peaks positions in red.
- here you can estimate the uncertainty on 2θ : determine the maximal width of the peak line for which the spots of each line do not mix.
- compute and save G-vectors : 'transformation' > 'compute g-vectors' then 'transformation' > 'save g-vectors' (do not forget to end the name of the file with .gve)
- in the menu 'Indexing' use 'load g-vectors' and choose your gve file.
- then use 'Indexing' > 'Assign peaks to powder rings' to see in the command windows the hkl plan associated to each Debye Ring of your diffraction data and the number of mesurements found for each of them.
With that G-vectors file, you will be able to use GrainSpotter to find your original grains.
From G-vectors to grains
You can now index your diffraction peaks with GrainSpotter.
But before entering the commande line in the Konsole, you must complete the input file : index.ini. In that file you must write the same parameters you used in your experiment/simulation and in ImageD11, but you can vary :
- the 2θ range;
- the cut
- the uncertainties
- the random number
Changing the 2θ range allow you to exclude some domains where the peaks are not well defined.
You should play on the cut and the uncertainties to found the settings with the best indexation. Increasing the minimum of measurements allow to decrease the number of erroneous indexed grains but it limite the number of indexed grains found. The uniqueness and the completness do not have a great importance on the indexation (I set both to zero in my best indexation scenario). For defining the incertainties, use the plot from fabian and ImageD11.
Increasing random number increase the number of grains indexed but slow a bit the calculation.
When your input file is ready, type :
GrainSpotter.0.90 index.ini
nb : the commande GrainSpotter instead of GrainSpotter.0.90 work too, I do not know what is the difference.