Table of Contents
Grain indexing with ImageD11
ImageD11 can also do indexing, using a completely different philosophy from that of GrainSpotter.
The idea is based on the following:
- Select 2 diffraction rings from your sample,
- For each pair of peaks (one on each ring):
- Test whether those 2 peaks could belong to the same grain,
- If so, calculate the corresponding grain orientation, and generate a test orientation
- For each test orientation generated above, look for more peaks that could be assigned to this grain. If a given threshold is reached, accept the grain as a true grain.
The indexing start from a set of g-vectors, which you should have generated with ImageD11 previously (refer to the section on computing G-vectors). You should also have and ImageD11 parameter file, with the proper experimental parameters and unit cell information.
First evaluation
To start an indexing with ImageD11:
- Go into the menu item of ImageD11, click on
IndexingandLoad g-vectorsand select your .gve file - Use
IndexingandAssign peaks to powder rings. The result of this computation will appear in the command line. It shows all theoretical peaks for your unit cell (for the phase defined intransformation>parameters) as well as the number of measured g-vectors assigned to each theoretical peaks. - Select a pair of 2 peaks in this list: Good peaks for indexing have a low multiplicity and lots of assigned g-vectors. Use the menu item
Indexing,Edit parametersand enter the index of these rings as ring_1 and ring_2. PressOKto close the parameter window. - Click
IndexingandGenerate trial orientation, followed byIndexingScore trial orientation. At the end the number of grains indexed is shown in the command line. - From here you need to save the .ubi file (a file with a list of UBi matrices for indexed grains) with
IndexingandSave UBI matrices.
In a second stage, you can use a command like
makemap.py -p parameters.prm -f peaks_to.flt -u to.ubi -U t0.map --omega_slop=.25 -t .03
where
-p is the ImageD11 parameter file
-f is the original peak file
-u is the file with the UBi matrices of the indexed grains
-U the name of the file in which to output the refined UBi matrices
–omega_slop the omega step size
-t a tolerance for peak assignment.
makemap.py will first assign peaks to grains. The first grains will have more peaks assigned, as they will be harvesting peaks first. Grains analyzed later will be compared to what is left in the peak database. To correct for this caveat, the script will then come back on the indexing and compare the peaks of all indexed grains to distribute them more equally and to the best fitting grains, while refining the UBi matrices for all grains.
Automatization of this indexing process
You can copy the commands in a bash file like the idx_0.py we made.
In that script, you need to load your .gve file (from ImageD11), your parameters file (from ImageD11) and your peaks file (from peaksearch). Don't forget to specify the name of the output file. In the line myindexer.parameterobject.set_parameters, you can set the indexing parameters (mainly minpks and hkl_tol). To specify the rings you want to use for the indexing, copy the list of peaks you obtained from Assign peaks to powder rings in the block below rings = [] and enter in that rings = [] list the index of the rings you want to use.
This script will pair every ring with all the other to index the peaks in grains.
At the end, it will give you the number of grains it found. Once it is finish, the indexed grains are stored in a ubi file and you can get back the not indexed grains to run idx.py again with more generous parameters and try to found more grains with the left peaks.
Evaluate the results
To have a look at what you indexed you can plot different things: (command for plot were written in a Xterm terminal)
Plot the number of peaks in grains vs the error
Click Indexing and Histogram fit quality
Plot the number of peaks in a grain vs the intensity
 from ImageD11.columnfile import *
 c = columnfile("peaks_t0.flt.new")
 c.parameters.loadparameters("parameters.prm")
 c.updateGeometry()
 clf()
 c.filter(c.tth<13)  % we only keep the rings below 13° cause after it's too low intensity
 plot(c.tth[~(c.labels>=0)], log(c.sum_intensity[~(c.labels>=0)]),",")
or:
plot(c.labels, log(c.sum_intensity),",")
to save it
c.writefile("t0la.flt")
Plot tth vs intensity
plot(d.tth, d.sum_intensity,"o",ms=5)
with d the variable containing the peaks
More plotting options ...
??
plotgrainhist.py peaks_t0.flt parameters.prm t0.map .05 10 .25
Using only the best rings
We run into the problem that in simulated datasets, a large number of peaks have an intensity below 1 and when saving the images, these intensities are rounded to 0. Consequently, these peaks are not detected anymore by the software. To resolve this issue, we want to consider only peaks with large intensity. So, to select the rings we want to use :
python pickrings.py ../Simulation/simu_FoCIF_omega-28-28_1000grains.flt parameters.prm fewr_ideal.flt
The inputs are :
- the name of the peak file you use
- the name of the parameters file from ImageD11
- the name of the output file (with the .flt extension)
After that, run again the indexation (Indexing > Generate trial orienation, followed by Indexing > Score trial orientation, then makemap.py or idx_0.py) with your new .flt file.
For now, we still miss grains…
Using only the peaks of the selected phase
This script is able to select the 2theta angles corresponding to a certain phase and save only the peaks on these angles in a peaks file (.flt).
First, get the script from github:
 git clone http://github.com/FABLE-3DXRD/ImageD11
 cp ImageD11/sandbox/ringselect.py
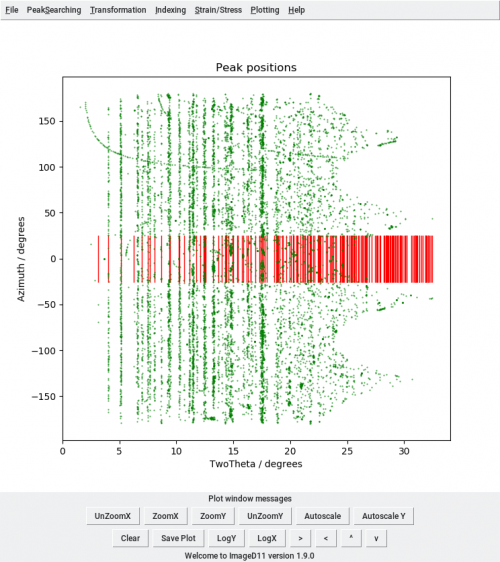
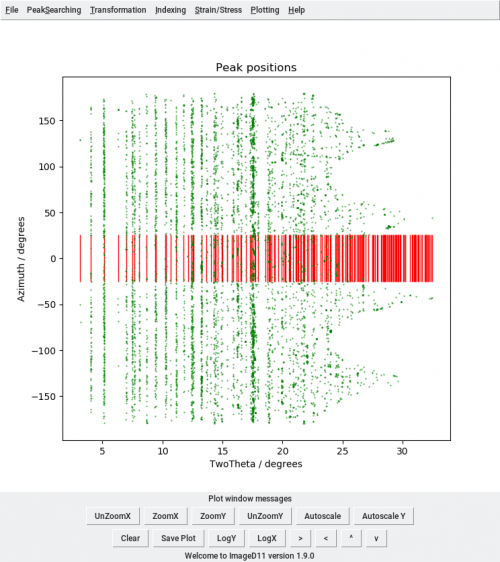
Then open ImageD11 and load the peaks file with (Transformation, Load filtered peaks), the parameters (Transformation, Edit parameters), plot the peaks in cake view (Transformation, Plot tth/eta) and add the unit cell peaks (Transformation, Add unit cell peaks). The plot shows the whole data set.
Now you can run the script:
python ringselect.py peaks_t100.flt CEns_parameters.prm 0.05 7 ringselect.flt 0 100000
The input parameters are:
- the peaks file you used in ImageD11
- the parameters you used in ImageD11
- the tth tolerance
- the tth max
- a name for the output file (with the extension .flt at the end);
- the minimum number of peaks intensity (in pixels) you want for the cut (zero if you want to use all peaks)
- the number of peaks per ring (put a really large number to be sure to have them all)
It should show a plot of the whole data set vs the peaks it will keep. If you have problem with the plot output, you must set up your matplot configuration:
 ~/.config/matplotlib/matplotlibrc

 vi ~/.config/matplotlib/matplotlibrc
and then activate the TKAgg backend.
When you import the new peaks file in ImageD11 tth/eta plot, you will have only the selected peaks.
The idea of this script is to index one phase after another and be able to remove the peaks of the grains indexed. This will avoid reusing already indexed peaks and make the indexing of the weaker phases easier.

