Table of Contents
Multigrain crystallography experiment geometry
Experiment geometry
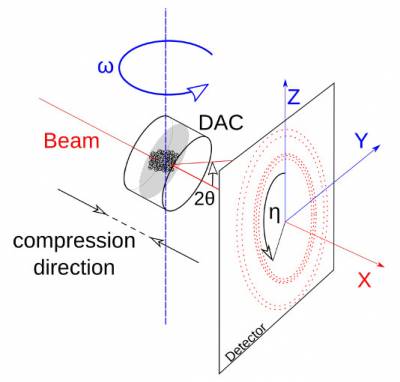
Geometry and axes are important for multigrain crystallography experiment. You need to know how is your experiment relative, how are you rotating, what are x, y, z axes ?
The figure below gives an outline of a typical definition of laboratory axes and angles

Fig. 1: Experimental setup
More precise and detailed calculations are available in this file, extracted from the fable project: fable_geometry_version_1.0.8.pdf.
Detector orientation
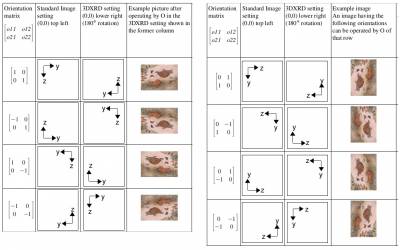
Because of the way data is saved in image files, there are always confusions with the orientation of detector images. They can be flipped in any way you can think of.
Here is an example, taken from an old Fable manual (Note: one of the example is wrong, I did see that some times ago, seb)

Fig. 2: Example for the 8 possible orientations of a 2D image.
Again, more precise definitions and calculations can be found in a former Fable manual: fableimageorientdoc_0.5.pdf
Example: How to find out my own O-matrix
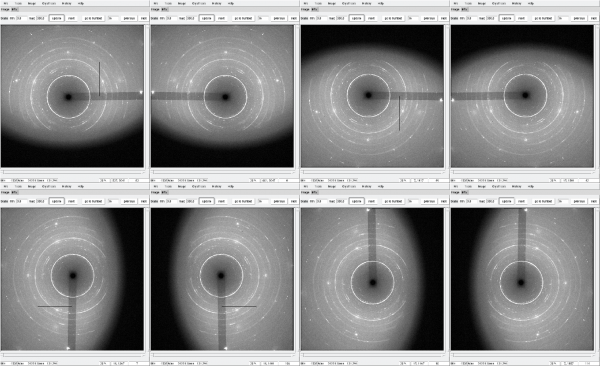
Let's assume our sample is rotated from ω1 = -20° to ω2 = +20° during the acquisition. When you reach extreme ω values you can see a shadow on one side of the diffraction images. These shadows originate from the DAC which has a limited opening angle on the outside. The further you rotate, the less 2θ angles are visible.
It's logically that the shadow of ω1 is on the opposite side of the shadow of ω2. But how do we have to rotate the images so they express reality?
Let's do it for the image at ω1 = -20°
Fig. 3: Example for different orientations of the same image.
Step 1
Ask the beamline scientist if the images are saved in a different orientation than the actual setup geometry.
If this is not the case and the diffraction image on the screen is the same as the one you would see when you had a photofilm, everything is fine. But if it is the case, it makes it more complicated. You have to keep it in mind for the following steps.
Step 2
Have a look at the sample stage. In which orientation is the rotation taking place? Where is the rotation axis pointing?
I guess in most setups the rotation axis of ω is pointing to the top or to the bottom (like the Z-direction in figure 1). From this you can conclude that the shadow in our diffraction image has to be either on the right or on the left side of the image. With this information you can already exclude 4 out of the 8 possible orientations.
Step 3
Look for the beamstop in the experimental setup. Where is it coming from? Where should it be in the image?
For this example, let's assume it comes from top. Knowing where the beamstop is located, you can exclude two more possible orientations.
Step 4
Watch the sample stage carefully while it is rotating. Is it rotating clockwise or counterclockwise during the image acquisition?
Let's assume we observe that it is rotated counterclockwise when we look at it from top. This means that the image at ω1 = -20° should see a shadow on the left side. Think about it carefully and try to follow and understand this conclusion.
Conclusion
If you have followed the example in the right way, you should have come up with the solution that Orientation #8 is the correct one (corresponds to O-matrix [0,-1,-1,0]).
