Table of Contents
In the works: indexing a complex dataset with many phases
When you have sample with multiple phases, your list of extracted experimental g-gvectors (the bottom section of your GVE file, see example at the link) includes vectors that could originate from all phases in your sample.
Here is how we proceed:
- First work on our list of g-vectors to identify our phases and peaks,
- Generate custom GVE files for each phase we will work on,
- Run series of indexings, one phase after another, and multiple times.
Identify phases and peaks
One of the most critical tasks of this work is to know what you are looking for. In our case, we typically have
- 2 or more sample phases, often with complex structures and many peaks,
- a pressure medium, often a simple cubic phase, with one peak.
To do so, it is much better to work on an 2θ-histogram of the experimental g-vectors.
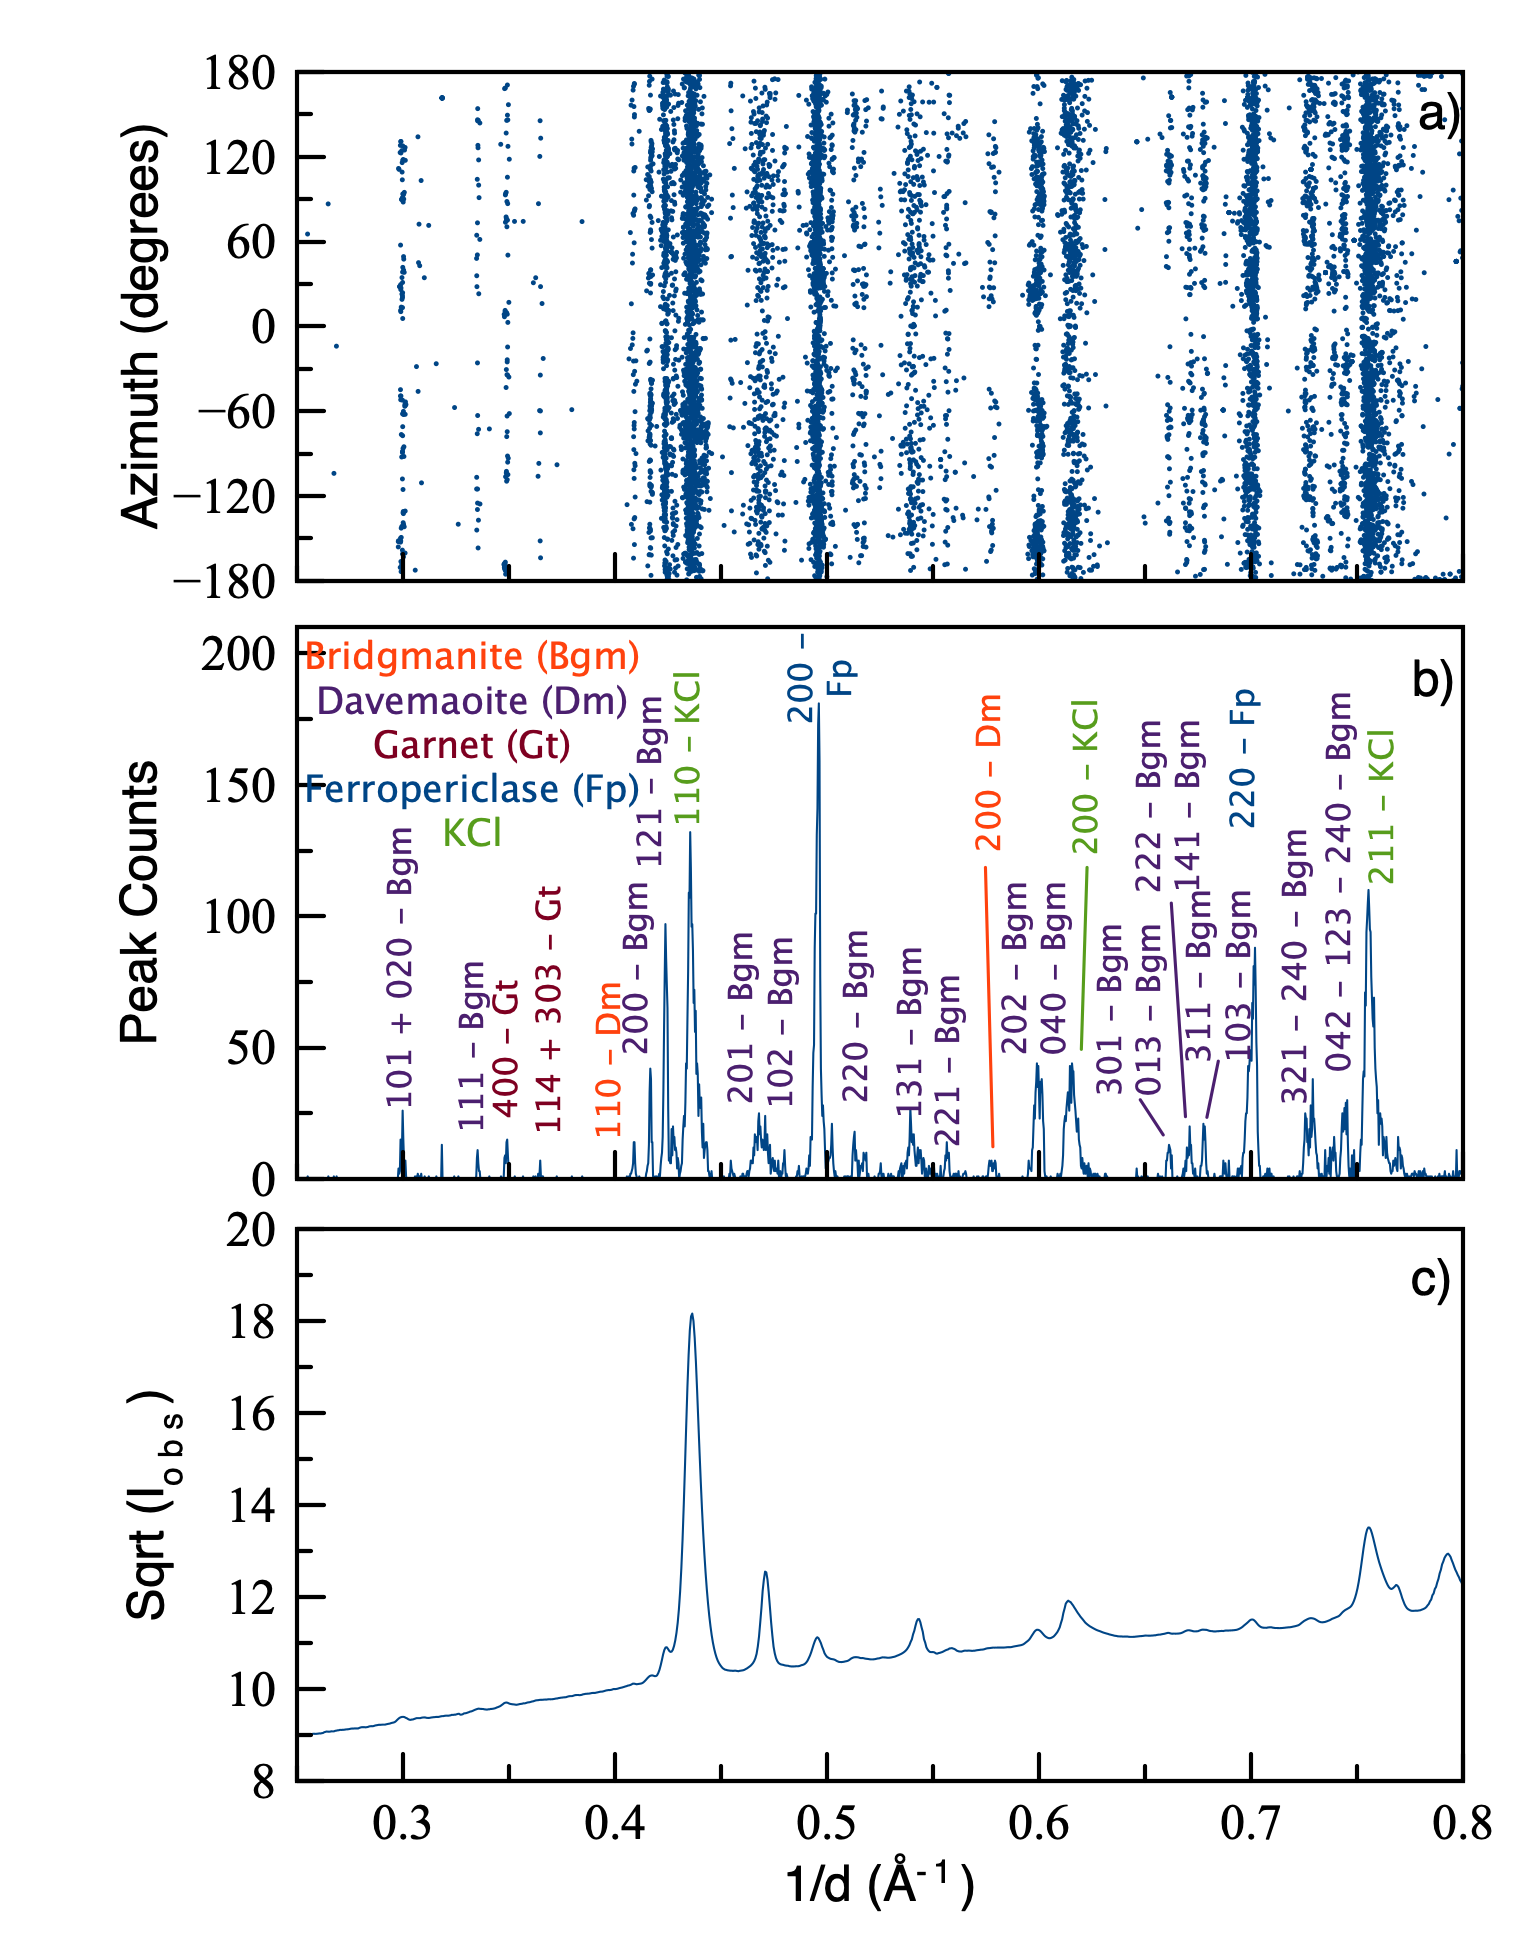
The figure on the right shows an example from Gay et al, published in Earth and Planetary Science Letters in 2023 [doi: 10.1016/j.epsl.2023.118015]. The sample holds 4 sample phases and a pressure medium (KCl). Top image is an ω-stack for all experimental g-vectors, potted as a function of ds and η. The bottom image is what you get if you try to index an average diffraction image directly. The middle panel is what is extracted from a 2θ-histogram of the experimental g-vectors.
The histogram is less affected by very large grains (the pressure medium in our case). In addition, experimental peak broadening, due to the instrument or the sample properties such as grain size or microstrains, have been removed since we only consider the center of mass of eack peak.
You can then use your favorite powder diffraction software, such as PDIndexer or MAUD to identify sample phases and their unit cell parameters. Just keep in mind that peak intensities in the histograms are not true intensities, but a number of experimental g-vectors.
Custom GVE files for each phase
We will need a custom GVE file for each phase we want to index. In those files (see detailed file format here):
- the first line needs to be altered with the unit cell parameters and lattice centering (one of P,A,B,C,I,F),
- the section on computed theoretical g-vectors for the unit cell needs to be updated,
- The actual scattering vectors (g-vectors) extracted from the experimental data below is identical for all phases, since we do not know how they are assigned.
Use a tool like timelessPeaksFromCIF, for each of the phases you wish to consider, and create a custom GVE file with the proper unit cell parameters, lattice centering, and computed theoretical g-vectors.
In our case, we do not index peaks from the pressure medium, but simply ignore the corresponding 2θ in the indexing. This can be easily done by specifying custom 2θ ranges in the GrainSpotter input file.
Indexing loop
Let's say your sample consist of 3 phases, phaseA, phaseB, phaseC, with the 3 corresponding experimental GVE files, phaseA.gve, phaseB.gve, phaseC.gve. The indexing process will go as follows
- index grains for phaseA, with a strict set of tolerances,
- remove the assigned experimental g-vectors from all 3 phaseA.gve, phaseB.gve, and phaseC.gve,
- index grains for phaseB, with a strict set of tolerances,
- remove the assigned experimental g-vectors from all 3 phaseA.gve, phaseB.gve, and phaseC.gve,
- index grains for phaseC, with a strict set of tolerances,
- remove the assigned experimental g-vectors from all 3 phaseA.gve, phaseB.gve, and phaseC.gve,
- and repeat the process as many times as necessary, with the same tolerances, and then increasing tolerances to catch most sample grains, merging all the indexed grains into one master file.
You can either run this by hand, your use a fancy loop with a bash script. We actually spent some time working on such a loop, and you can find an example of a multiphase indexing loop here.
Preparing figures
This will be written later. We are still waiting for some publications to be accepted.